Running a Java application in Docker on a VM hosted in the cloud is not uncommon these days. But let’s take a closer look at this setup. We have a bare metal box somewhere in the cloud provider’s data center and hypervisor host OS running on that box. Next, we have a guest OS running in a VM provided by the hypervisor. Docker is running in the guest OS and provides a container runtime. Not to mention JVM in the container, which is also a type of VM.
To sum it up, we have virtualization, container, and JVM all inside each other, stacked as a nesting doll.
A big promise that container technologies give us developers is being able to control the environment for applications to run. Ideally, once packed in a Docker or Podman container, the application should behave the same regardless of where it started.

Sometimes, things do not work as expected, and you have to learn the internals of Linux container technologies to fix problems.
In this post, I would like to cover a few typical caveats of container resource management and networking with a view on JVM.
Table of Contents
Virtualization
While this post is specifically about JVM and Linux containers, I would like to explain how containers are different from virtualization first.
The key idea of virtualization is to execute normal binary code inside a VM retaining semantic of CPU architecture but controlling resource usage and device access. A security boundary around the VM is an essential part of virtualization.
Today virtualization typically utilizes CPU support, which helps to create a low overhead sandbox for guest OS. This also means that host and guest OS’s should have the same CPU architecture. Virtualization is also possible without special hardware support by simulating the execution of CPU instructions in software. Simulation-based virtualization, while slower, is still practical for running guests having CPU architecture different from the host (e.g., running ARM-based Android OS on x86_64 host).
JVM is also a simulator of sorts; it is running JVM bytecode on your host CPU architecture. And surprise, surprise, both JVM and modern CPU simulators are using JIT (Just in Time) compilation to improve simulation performance. JVM is not a real hypervisor, even if there are many parallels between JVM and virtualization hypervisor.
How are containers different from virtual machines?
Many people mistake containers for a kind of virtualization technology and form certain assumptions based on that misunderstanding. The major difference is that each VM on the hypervisor has a separate OS kernel (including own memory management, CPU scheduling, etc.). In contrast, all containers on the same host share the kernel between each other and the host. “Yet, I can run a CentOS container on my Ubuntu host, can’t I?” Yes, you can, although your CentOS would run with a kernel from the Ubuntu host (typically a few versions ahead). Thanks to Linux kernel stable contracts for syscalls, things just work even if userspace binaries were built for an older Linux kernel version (most of the time, at least).
“Hey, but I can run Docker on my macOS. Where is the Linux kernel there?” It is there alright, just running using virtualization, and all your Docker containers are running in Linux VM silently sitting on your macOS.
Containers are not a virtualization technology is an important fact to keep in mind. But what is a Linux container then? My casual answer is: Linux containers are just a glorified chroot.
Virtualization creates VM boundaries by controlling the execution of CPU instructions; the container boundary in Linux is created by controlling kernel syscalls.
Kernel syscalls surface is much wider, with multiple distinct Linux features rigged together to enforce container boundaries.
Below are key features used for Linux containers.
- cgroups is an important feature used to control resource utilization for containers. CPU and memory limits in containers are enforced via cgroups.
- Dedicated FS mounted as root in the container. For Docker, image content is mounted as root, other containers (e.g., LXC) may use a full-fledged file system on block devices for this purpose.
- Namespaces are another feature critical for container isolation. This feature of the Linux kernel makes it possible to control kernel resource visibility at the process level. In particular, it is used to control individual FS mounts, network devices, and user accounts at the container level.
- Virtual ethernet adapters and NAT are used to create container network isolation. Typically, a container would have its own set of network adapters that are connected to the outside world via NAT. Container runtime needs to do a lot of plumbing and may make features above work together consistently to create an experience of container isolation.
Why containers instead of VM?
The main reason is efficiency. The process started in the container is just another process started at the host OS. There is virtually no overhead between containerized and non containerized process execution. Virtualization, even hardware-assisted, always brings a noticeable toll on resource utilization and startup time. Although virtualization is evolving and new optimizations are popping up, it would never become a zero-cost abstraction.
Specifically, containers are very lightweight in terms of memory, while virtualization always urges you to have overhead for the copy of the kernel in each VM.
Why do I need to care about containers?
So we have a VM, inside a VM, inside a VM. “Why would I care?” you might ask. In an ideal world, you wouldn’t need to. Things just work there. However, ours is not an ideal world.
JVM (Java Virtual Machine) is a VM. Despite it not being a VM as per virtualization terms above, it is still an abstraction layer between code inside JVM and outside OS. To build an abstraction efficiently, JVM needs to be highly aware of the OS it is running on. There is a lot of OS-specific code in the OpenJDK codebase, a requirement for Java code to execute properly.
Containers are subtly challenging the status quo of how the OS behaves. And for JVM, a product with a long history, it is not always easy to adapt to the new rules of the game.
Honoring the limits
Memory and cpu limits are important features of containers. But they are controlled by cgroups and dangerously ignored by applications unless they have built-in support for cgroups.
Try running docker run -m 512m ubuntu free on Linux console. Container memory is limited to 512 MiB by -m 512m option, though free command would report memory statistics for the host OS.
Let’s now try a similar experiment with JVM and look at how it would restrict heap size depending on container size.
\> docker run bellsoft/liberica-openjdk-debian:11 java -XX:+PrintFlagsFinal -version | grep -iE "InitialHeapSize|MaxHeapSize"

   size_t InitialHeapSize             = 257949696      {product} {ergonomic}

   size_t MaxHeapSize                 = 4120903680     {product} {ergonomic}
\> docker run -m 512m bellsoft/liberica-openjdk-debian:11 java -XX:+PrintFlagsFinal -version | grep -iE "InitialHeapSize|MaxHeapSize"

   size_t InitialHeapSize             = 8388608        {product} {ergonomic}

   size_t MaxHeapSize                 = 134217728      {product} {ergonomic}
It looks like JVM recognizes cgroups memory limit. With the growing popularity of solutions based on cgroups (Docker included), JVM has to rework its resource allocation heuristics. Special handling for cgroups was also added (see JDK-8146115). Changes were introduced in OpenJDK 10 and backported to Java 8.
We can turn off this feature and see what happens.
Ok, JVM can detect memory limit, but how value for max heap size is calculated anyway?
MaxHeapSize now is calculated as -XX:MaxRAMPercentage * MEMORY_LIMIT where MEMORY_LIMIT is either cgroups limit or RAM available on the host machine.
MaxRAMPercentage is 25% by default, which is probably too small for a container case. You can easily adjust it and still keep your JVM heap limit relative to the container memory limit.
\> docker run -m 512m bellsoft/liberica-openjdk-debian:11 java -XX:MaxRAMPercentage=75 \

-XX:+PrintFlagsFinal -version | grep -iE "InitialHeapSize|MaxHeapSize"

   size_t InitialHeapSize             = 8388608        {product} {ergonomic}

   size_t MaxHeapSize                 = 402653184      {product} {ergonomic}
Besides memory limit, JVM acknowledges CPU limit and adjusts the number of GC threads based on container limits, too.
-XX:+UseContainerSupport flag responsible for cgroups awareness is on by default in OpenJDK 11 and above and since OpenJDK 8u191.
Russian roulette with oom killer
Following the previous exercise, you may ask: “Why not set MaxRAMPercentage to 100%?”
An important thing you should never forget regarding JVM memory is that heap size ≠ memory used. Without jumping straight into the rabbit hole of memory management, let’s play with container memory limits of container and JVM size and see what would happen.
I have prepared a short code snippet to play with.
import java.util.ArrayList;

import java.util.List;

public class HeapFiller {

    public static void main(String[] args) {

        Runtime runtime = Runtime.getRuntime();

        System.out.println("Max heap size: " + (runtime.maxMemory() >> 20) + "M");

        try {

            List<byte[]> data = new ArrayList<>();

            long lastMemUse = runtime.totalMemory() - runtime.freeMemory();

            while(true) {

                data.add(new byte[1 << 20]);

                long memUse = runtime.totalMemory() - runtime.freeMemory();

                if (memUse > lastMemUse + (20 << 20)) {

                    System.out.println("Heap usage: " + (memUse >> 20) + "M");

                    lastMemUse = memUse;

                }

            }

        } catch (OutOfMemoryError e) {

            System.out.println(e.toString());

            runtime.halt(0);

        }

    }

}
Save code as HeapFiller.java and build the Docker image using an ordinary build file.
FROM bellsoft/liberica-openjdk-debian:11

COPY *.java /app/

RUN cd /app && javac *.java
Build the image.
docker build -t testapp .
Now let’s see what would happen with -XX:MaxRAMPercentage=100.
/> docker run -m 512m testapp java -XX:MaxRAMPercentage=100 -cp /app HeapFiller

Max heap size: 494M

...

Heap usage: 465M

Heap usage: 485M

java.lang.OutOfMemoryError: Java heap space
Looks fine, we have filled the whole heap and got OOME in our code.
Let’s try to raise the heap size above the memory allowance of the container.
/> docker run -m 512m testapp java -Xmx2g -cp /app HeapFiller

Max heap size: 1979M

...

Heap usage: 767M

Heap usage: 787M

Heap usage: 807M
In this run, the JVM process is just killed. No “out of memory” or other errors, the container has simply disappeared.
And still, if I run dmesg, the error is easily spotted.
\> dmesg

[97773.657826] oom-kill:constraint=CONSTRAINT_MEMCG,nodemask=(null),cpuset=80f0e7d30336357ce04b4dda36a72c79f0677913b9a5988357845e43cc7d5a54,mems_allowed=0,oom_memcg=/docker/80f0e7d30336357ce04b4dda36a72c79f0677913b9a5988357845e43cc7d5a54,task_memcg=/docker/80f0e7d30336357ce04b4dda36a72c79f0677913b9a5988357845e43cc7d5a54,task=java,pid=13413,uid=0

[97773.657872] Memory cgroup out of memory: Killed process 13413 (java) total-vm:4321312kB, anon-rss:518932kB, file-rss:19428kB, shmem-rss:0kB

[97773.701215] oom_reaper: reaped process 13413 (java), now anon-rss:0kB, file-rss:0kB, shmem-rss:0kB

[97773.816474] docker0: port 1(veth8303ede) entered disabled state

[97773.817047] veth658eeeb: renamed from eth0

[97773.894689] docker0: port 1(veth8303ede) entered disabled state

[97773.898459] device veth8303ede left promiscuous mode

[97773.898465] docker0: port 1(veth8303ede) entered disabled state

This is the way memory limits are enforced in containers. Breach the limit, and you are dead. No warnings, no second chances.
But why did we get killed at 807MiB of heap usage (and why log shows anon-rss:519MiB)?
cgroups can control both resident memory and swap memory utilization. Docker option -m 512m is interpreted as 512MiB of resident memory + 512MiB of swap memory (though only if swap is enabled in the system). So the effective limit was 1GiB.
Speaking of swap, it is typically enabled on desktops and small VMs. However, servers with high amounts of RAM often have swap disabled (e.g., most images on AWS except the smallest ones have swap disabled). Your container can run locally but crash being deployed on the target environment due to lack of swap.
We can control the swap limit directly. Now it’s time to disallow swap usage. Combination -m 512m --memory-swap 512m will restrict total memory usage to 512MiB.
\> docker run -m 512m --memory-swap 512m testapp java -Xmx2g -cp /app HeapFiller

Max heap size: 1979M

...

Heap usage: 445M

Heap usage: 465M

Heap usage: 485M
Now the container is killed near its expected limit. Let’s try -XX:MaxRAMPercentage=100 again.
\> docker run -m 512m --memory-swap 512m testapp java -XX:MaxRAMPercentage=100 -cp /app HeapFiller

Max heap size: 494M

...

Heap usage: 446M

Heap usage: 466M

Heap usage: 486M

java.lang.OutOfMemoryError: Java heap space
We got a JVM level error now. This application is very simple, though, just one thread and tiny code size.
The example below both creates threads and fills the heap with objects
import java.util.concurrent.ArrayBlockingQueue;

import java.util.concurrent.CountDownLatch;

import java.util.concurrent.Exchanger;

import java.util.concurrent.Executor;

import java.util.concurrent.ThreadPoolExecutor;

import java.util.concurrent.TimeUnit;

public class ThreadSpawner {

    static CountDownLatch LATCH = new CountDownLatch(1);

    public static void main(String[] args) {

        Runtime runtime = Runtime.getRuntime();

        int recursionDepth = Integer.getInteger("depth", 128);

        try {

            Executor pool = new ThreadPoolExecutor(Integer.MAX_VALUE, Integer.MAX_VALUE, 1,

                    TimeUnit.SECONDS, new ArrayBlockingQueue<>(10));

            long lastThreadCount = Thread.activeCount();

            while(true) {

                Exchanger<String> ex = new Exchanger<>();

                pool.execute(() -> recursiveTask(recursionDepth, "", ex));

                ex.exchange("");

                if (Thread.activeCount() > lastThreadCount + 50) {

                    long memUse = runtime.totalMemory() - runtime.freeMemory();

                    System.out.print("Heap usage: " + (memUse >> 20) + "M");

                    System.out.println(" | Thread count: " + Thread.activeCount());

                    lastThreadCount = Thread.activeCount();

                }

            }

        } catch (InterruptedException e) {

            System.out.println("Interrupted");

        } catch (OutOfMemoryError e) {

            System.out.println(e.toString());

            Runtime.getRuntime().halt(0);

        }

    }

    public static void recursiveTask(int depth, String input, Exchanger<String> receiver) {

        try {

            if (depth == 0) {

                receiver.exchange(input);

                // block thread

                LATCH.await();

            } else {

                recursiveTask(depth - 1, input + String.valueOf(new byte[10 << 10]), receiver);

                // prevent GC from collecting variable before the call

                input.length();

            }

        } catch (InterruptedException e) {

            System.out.println("Interrupted");

        } catch (OutOfMemoryError e) {

            System.out.println(e.toString());

            Runtime.getRuntime().halt(0);

        }

    }

}
Save code as ThreadSpawner.java and rebuild the Docker image.
Now let’s try to run it with 512MiB of memory limit.
\> docker run -m 512m --memory-swap 512m testapp java -XX:MaxRAMPercentage=100 -cp /app ThreadSpawner

...

Heap usage: 43M | Thread count: 409

Heap usage: 60M | Thread count: 460

Heap usage: 59M | Thread count: 511
With lots of threads, the container is killed much earlier reaching just 62MiB of heap utilization.
It should surprise you at this point. Each thread requires a stack occupied outside of the heap.
Can we reduce stack size? The default stack size is 1024 KiB. If we cut it in half, the container should survive more threads.
\> docker run -m 512m --memory-swap 512m testapp java -XX:MaxRAMPercentage=100 -XX:ThreadStackSize=512 -cp /app ThreadSpawner

...

Heap usage: 45M | Thread count: 409

Heap usage: 44M | Thread count: 460

Heap usage: 62M | Thread count: 511
No effect. The container has survived the same number of threads.
Instead of tweaking JVM options, let’s change recursion depth in the application code. With option -Ddepth=64 recursion depth is code snippet would be limited to 64 instead of 128.
\> docker run -m 512m --memory-swap 512m testapp java -XX:MaxRAMPercentage=100 -Ddepth=64 -cp /app ThreadSpawner

...

Heap usage: 31M | Thread count: 919

Heap usage: 28M | Thread count: 970

Heap usage: 38M | Thread count: 1021
Now the container can survive roughly two times more threads.
The reason for such behavior is that memory for thread stack is allocated lazily. JVM reserves address space for stack, but real memory allocation happens only then the memory page (usually 4 KiB) is touched by the app.
JVM has other memory areas apart from heap. Even though they are not as large as heap typically, they have to be accounted for too.
Key JVM memory areas are
- Heap - our plain Java objects are stored here, heap size can be limited with
-Xmxoption. - Metaspace - holds class-related data structures, grows with more classes being loaded. Metaspace can be limited with
-XX:MaxMetaspaceSizeoption. - Threads - each live thread needs a stack. Individual stack size can be tuned with
-XX:ThreadStackSize, but the number of threads is driven by application. - Direct memory - non-heap memory available via java.nio package. Direct buffer memory pool can be limited by
-XX:MaxDirectMemorySize, the default limit is equal to the max heap size. - Code cache - used for binaries of JIT-compiled code.
-XX:ReservedCodeCacheSizeoption controls maximum memory used for code cache.
This is not a full list. Native memory tracking, covered later in this post, could be enabled to get a detailed memory report from the JVM runtime.
Memory related things quickly become insanely complex if you are trying to build an accurate picture.
Do you need to know all this just to run your web app in a container? Probably not.
Allow me to summarize the takeaways.
- Containers have separate limits for resident memory and resident + swap memory used by the process. Different container runtimes use different ways to set this limit.
- JVM scales itself based on the container resident memory limit. Although the default factor is 25%, which is too small for a dedicated Java application container.
-XX:MaxRAMPercentage=75would set the factor to 75%, a more sensible starting point in that instance. - JVM scales only heap space. You need to keep in mind other areas too. Pay special attention to the number of threads, especially in small containers.
- Once the container memory limit is breached, do not expect any exception within JVM or shutdown hooks execution, it just gets terminated.
Discover recommendations on tuning the JVM for resource constrained containers in a dedicated guide.
Native memory tracking
Native memory tracking is a JVM feature that can help you understand your memory budget including both heap and non-heap memory spaces.
Native memory tracking should be enabled on the JVM command line via -XX:NativeMemoryTracking=detail flag.
Later you could use jcmd to dump memory usage reports from JVM. An example of a summary level report is below.
\> jcmd 12345 VM.native_memory summary

Native Memory Tracking:

Total: reserved=1822547KB, committed=62203KB

-                 Java Heap (reserved=393216KB, committed=24676KB)

                            (mmap: reserved=393216KB, committed=24676KB)

-                     Class (reserved=1056947KB, committed=5811KB)

                            (classes \#735)

                            (  instance classes \#640, array classes \#95)

                            (malloc=179KB \#1340)

                            (mmap: reserved=1056768KB, committed=5632KB)

                            (  Metadata:   )

                            (    reserved=8192KB, committed=5120KB)

                            (    used=4825KB)

                            (    free=295KB)

                            (    waste=0KB =0.00%)

                            (  Class space:)

                            (    reserved=1048576KB, committed=512KB)

                            (    used=454KB)

                            (    free=58KB)

                            (    waste=0KB =0.00%)

-                    Thread (reserved=115662KB, committed=16334KB)

                            (thread \#112)

                            (stack: reserved=115128KB, committed=15800KB)

                            (malloc=405KB \#674)

                            (arena=129KB \#222)

-                      Code (reserved=247772KB, committed=7632KB)

                            (malloc=84KB \#741)

                            (mmap: reserved=247688KB, committed=7548KB)

-                        GC (reserved=1333KB, committed=133KB)

                            (malloc=45KB \#159)

                            (mmap: reserved=1288KB, committed=88KB)

-                  Compiler (reserved=165KB, committed=165KB)

                            (malloc=32KB \#68)

                            (arena=133KB \#5)

-                  Internal (reserved=4674KB, committed=4674KB)

                            (malloc=4642KB \#1679)

                            (mmap: reserved=32KB, committed=32KB)

-                    Symbol (reserved=2055KB, committed=2055KB)

                            (malloc=1247KB \#2917)

                            (arena=807KB \#1)

-    Native Memory Tracking (reserved=385KB, committed=385KB)

                            (malloc=187KB \#2643)

                            (tracking overhead=198KB)

-               Arena Chunk (reserved=188KB, committed=188KB)

                            (malloc=188KB)

-                   Logging (reserved=4KB, committed=4KB)

                            (malloc=4KB \#191)

-                 Arguments (reserved=18KB, committed=18KB)

                            (malloc=18KB \#476)

-                    Module (reserved=59KB, committed=59KB)

                            (malloc=59KB \#1027)

-              Synchronizer (reserved=63KB, committed=63KB)

                            (malloc=63KB \#494)

-                 Safepoint (reserved=8KB, committed=8KB)

                            (mmap: reserved=8KB, committed=8KB)
You can replace summary with detail in the command above to get an even more detailed report.
JVM can also calculate memory usage difference.
- Use jcmd PID VM.native_memory baseline to capture baseline.
- Later use jcmd PID VM.native_memory summary.diff or jcmd PID VM.native_memory detail.diff to get a report of changes in memory usage.
Native memory tracking is useful for investigating abnormal memory usage by JVM, but it does cover only JVM memory areas. There is still libc heap used by JVM or other native code loaded into the process, which is not accounted for by this report.
Networking
Networking is another part of the container isolation boundary. A container has its own loopback adapter (127.0.0.1) and one or more virtual Ethernet adapters to speak to the rest of the world.
A virtual network interface of a container is typically NATed through the host’s network interface—not only an option but the most common one.
NAT (Network Address Translation) is a widely used technology. But it is introduced in a very unexpected place with containers.
VPN and the mystery of hanging connections
One issue with NAT is the inability to process fragmented IP packets (in the case of port-based NAT). Again fragmented IP packets are rare on the network, but a combination of VPN and NAT on the same host machine (e.g., developers desktop) could introduce funny network issues. VPN may have a lower MTU than normal network and break packets into fragments. Small pieces of data would pass smoothly between an application in the container and service on the other side of VPN. Yet, once the size of data reaches a certain limit, connection hangs forever.
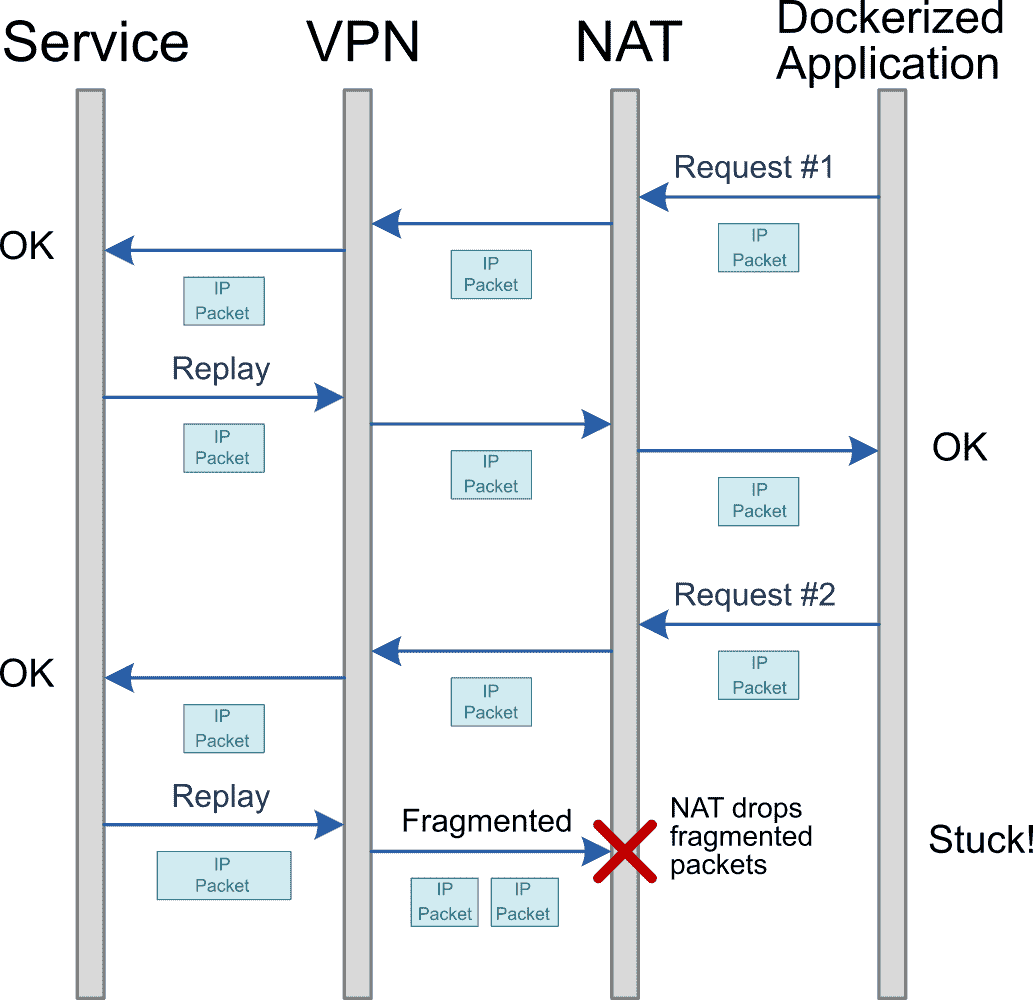
Docker has an option to disable network isolation, which helps to work around such problems.
Kernel level resource limits
As the kernel is shared across all containers, certain global limits are applied to all containers too. Containers tend to be small; so, a good server could be stuffed with lots of them and exhaust these limits. The effect might be very obscure: say, the container is running fine on one node but experiencing network issues on another.
JMX in container
JMX is a TCP based protocol used by JVM to communicate with diagnostic tools. JMX is an ancient protocol based on RMI (Remote Method Invocation) protocol endemic to the Java world.
On the JVM side, you need to add options to start listening on a particular port. Then remote tools such as Mission Control can connect to this port and start talking to the JVM. If you wonder why you would want to use Mission Control, take a look at my first article about JDK Flight Recorder.
Due to the idiosyncrasies of a JMX protocol, using it in containers becomes a challenge.
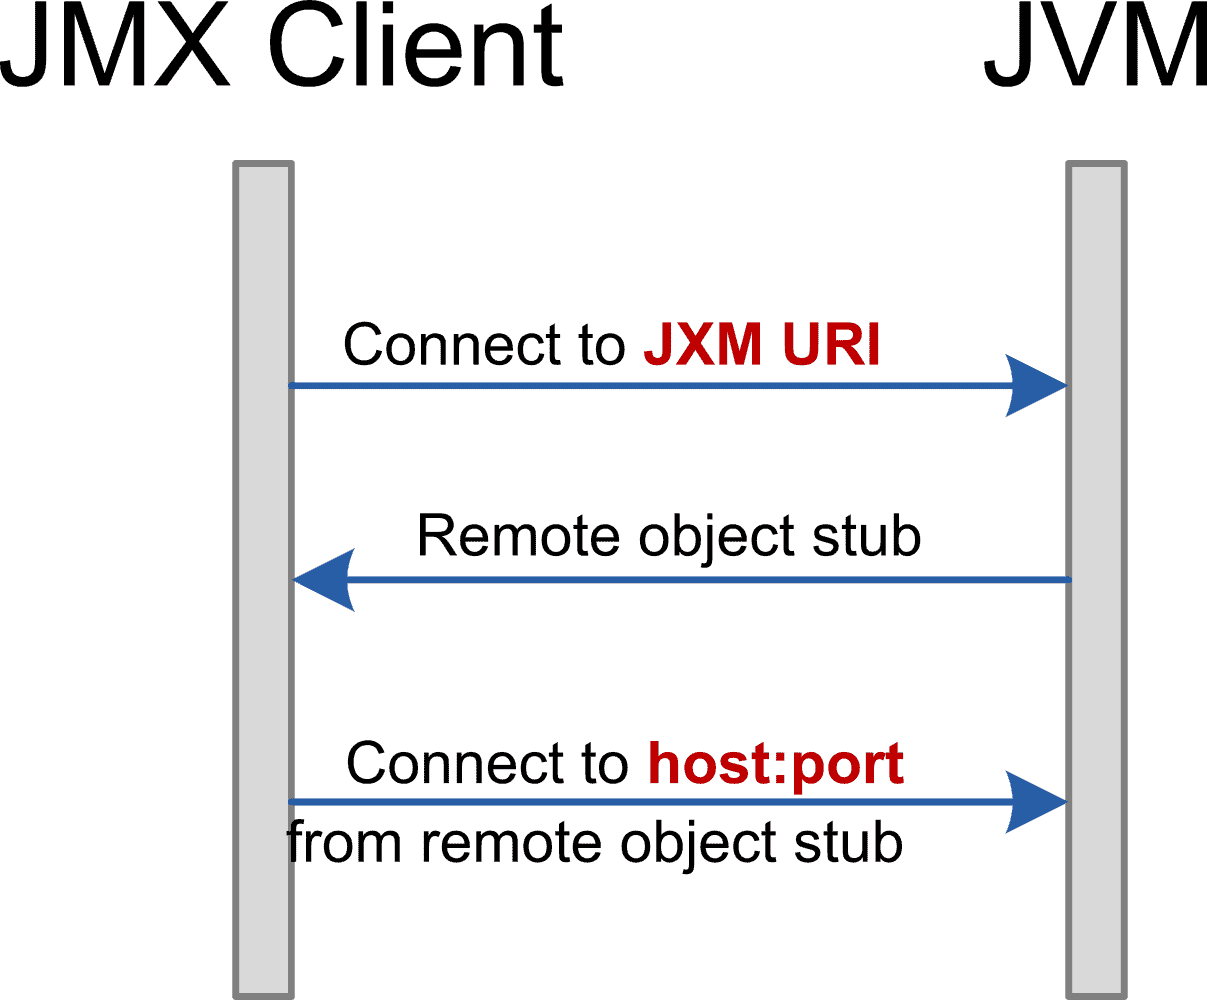
Above there is a sequence diagram of the JMX connection. A problematic piece is a serialized stub of a remote object with an IP address and a port the second connection would use.
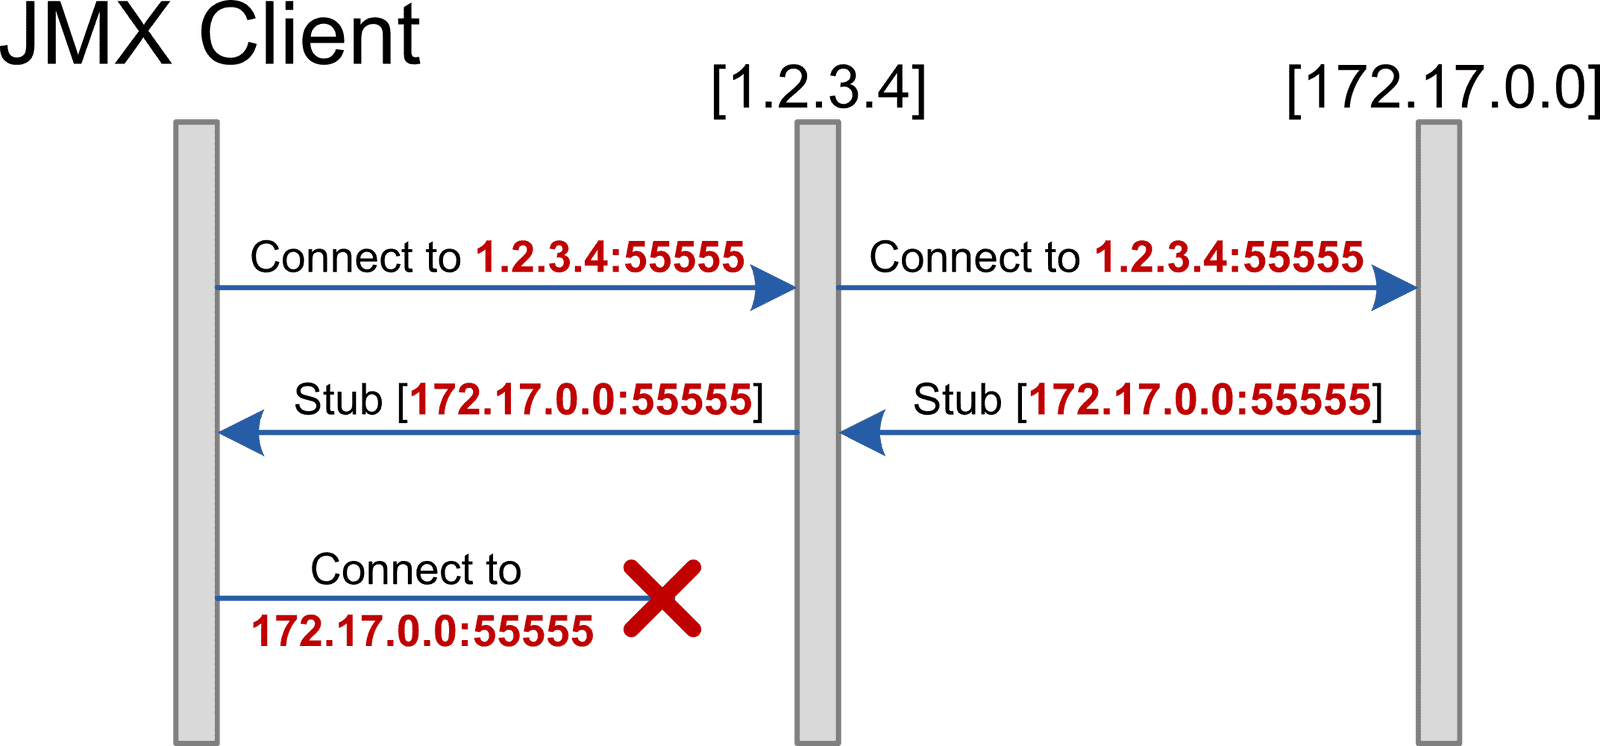
Below is an example of JVM options to listen to the JMX protocol on port 55555. With Docker, you would need to add port mapping with option -p 55555 to expose this port starting a container.
| JMX config options | Connection diagram |
|---|---|
| -Dcom.sun.management.jmxremote -Dcom.sun.management.jmxremote.authenticate=false -Dcom.sun.management.jmxremote.ssl=false -Dcom.sun.management.jmxremote.port=55555 -Dcom.sun.management.jmxremote.rmi.port=5555 |
One way to fix it is to override the address inside the stub.
| JMX config options | Connection diagram |
|---|---|
| -Djava.rmi.server.hostname=<MyHost> -Dcom.sun.management.jmxremote -Dcom.sun.management.jmxremote.authenticate=false -Dcom.sun.management.jmxremote.ssl=false -Dcom.sun.management.jmxremote.port=55555 -Dcom.sun.management.jmxremote.rmi.port=5555 |
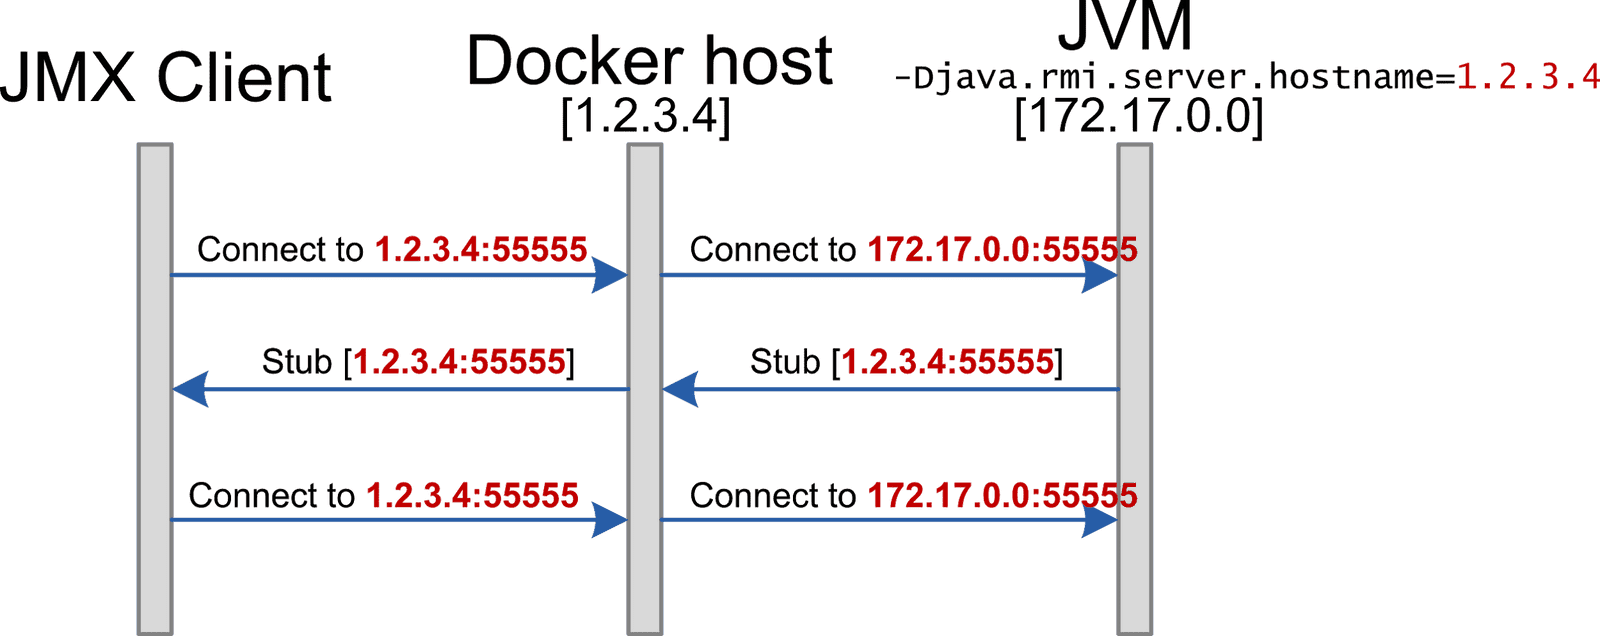
This being one solution, it will not work if you cannot connect to the container’s host directly or if the port cannot be exposed with the same number. In other words, Kubernetes would need to solve the problem differently.
Another solution requires forwarding.
| JMX config options | Connection diagram |
|---|---|
| -Djava.rmi.server.hostname=127.0.0.1 -Dcom.sun.management.jmxremote -Dcom.sun.management.jmxremote.authenticate=false -Dcom.sun.management.jmxremote.ssl=false -Dcom.sun.management.jmxremote.port=55555 -Dcom.sun.management.jmxremote.rmi.port=5555 |
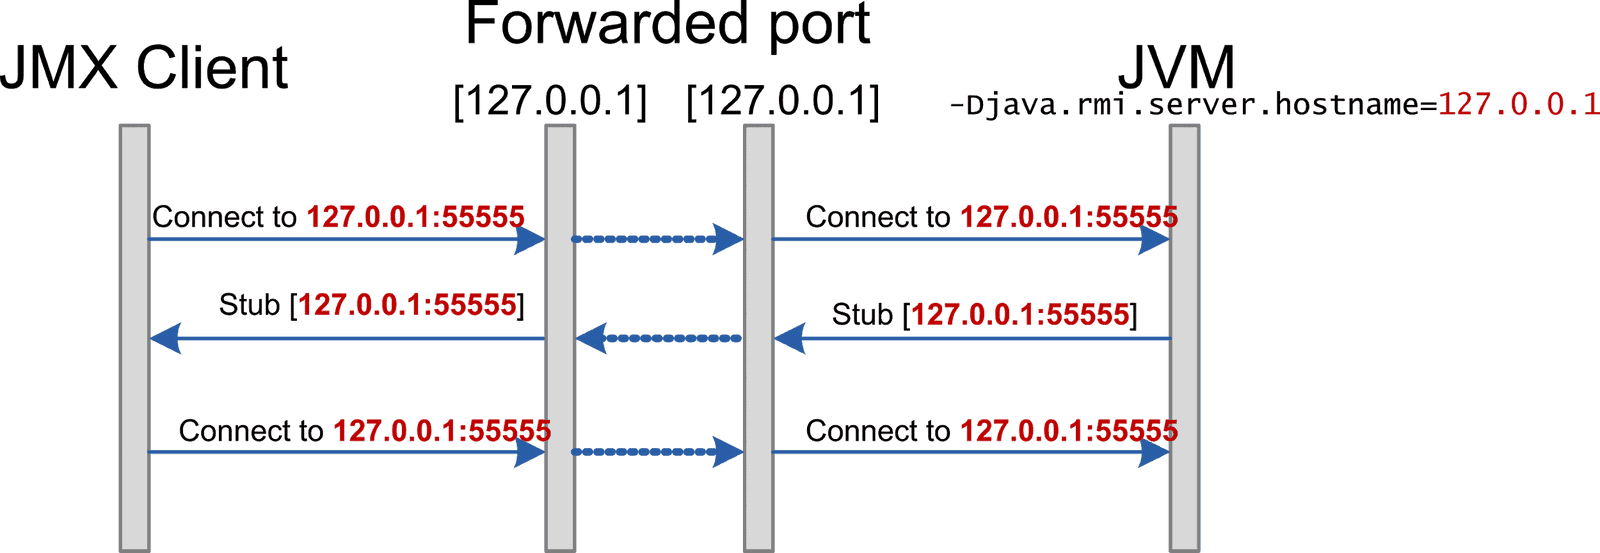
Such a setup would work with SSH tunnels and Kubernetes port forwarding.
Conclusion
Containers solve a lot of problems related to the deployment of complex applications. Unfortunately, they also bring in a bunch of new ones.
When things work, containers are great. But both software vendors and application developers have to be aware of runtime considerations specific to Linux containers.
The early years of container adoption were pretty rough for JVM, as many old configuration heuristics were failing miserably in containerized environments. Thanks to the work done by OpenJDK supporters, numerous issues have been addressed. Now OpenJDK is well prepared to run in containers.